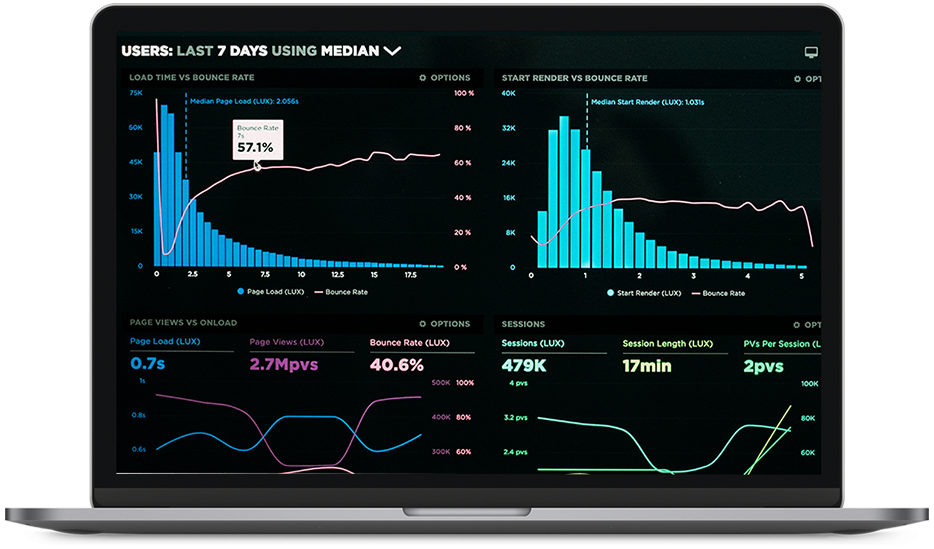
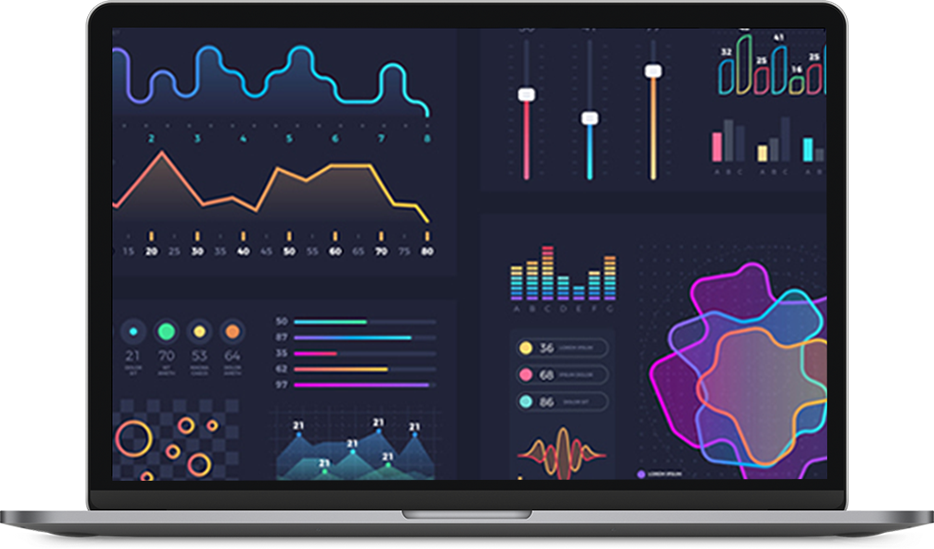
Business Intelligence
& Analytics

We provide a wide range of services to help you
achieve success at any stage of your data
analytics journey.

Data Visualization

DataVisualisation

Get data visualization to strengthen your reporting. We tailor visualization solutions so that they answer the business questions of every client.

Insightful reporting

We believe that users should not waste their time and effort on searching for insights; they should focus on making informed decisions, instead.

Relevant dashboards

We design our dashboards carefully, making sure that trends or outliers are recognized immediately, colors are relevant and chart types are consistent.

Defined user roles

We tailor reports and dashboards so that every user could focus on relevant data. For example, top level dashboard for top management management.

Drill-down and filtering

Options to filter and drill down so that they could answer their business questions by looking from different angles.

Contact US

Data Science

We, at ONE BCG, are devoted to data science services as we see many improvements that it can bring to businesses, regardless of the industry you represent.

Data cleanup

We will review your data, remove duplicates, erroneous and unreliable records. In a word, we’ll run all the required data cleaning procedures to ensure that your data is of high quality. In addition, we can advise what extra data can improve analysis accuracy.

Accurate predictions

Machine learning model predictions allow businesses to make highly correct guesses as to the likely outcomes of a question based on historical data, which can be about all kinds of things – customer churn likelihood, possible fraudulent activity, and more.

Noisy data

Our data consultants have a close look at your data to identify outliers. As a next step, we differentiate between signals and noise. Then we clear your data from unwanted noise, which ultimately improves the accuracy of your model.

Data Visualization

Comprehensive Reporting

Reporting is tailored to each client’s individual needs. Your unique business problem will decide a project’s timeline, benchmarks, and reporting strategy.

View operational reports

Data reporting in any output format – including tables, pivots, spreadsheets, charts, maps, graphs, and other visualizations. Share reports with other team members to improve collaboration and make faster decisions.

Data drill down

Using drill-down and drill up on your data points, you can explore in-depth details about your data. View reports from the summary to the lowest level of detail in any report, gain operational insights on-demand, and never overlook any critical data.